Most B2B merchants can tell you their revenue numbers, but ask about the actual return on their ecommerce investment and you’ll get a long pause. The challenge is that B2B ROI isn’t just about sales—it’s buried in operational savings, reduced manual work, and efficiency gains that rarely show up on a standard P&L.
This guide walks through how to calculate B2B ecommerce ROI accurately, which metrics actually matter, and the specific levers that drive higher returns for wholesale operations.
What is ROI in B2B ecommerce
ROI in B2B ecommerce is the percentage of net profit gained against your total digital investment. Unlike B2C, where success often hinges on acquiring new buyers, B2B ROI depends just as heavily on operational cost savings—self-service order tracking, reduced phone support, fewer manual data entry hours—as it does on revenue growth.
The concept captures both sides of the equation: what you earn and what you stop spending. A wholesale operation that processes orders faster, eliminates reconciliation errors, and frees up sales reps to focus on high-value accounts is generating ROI even before new revenue hits the books.
Why ROI matters for B2B merchants
Tracking ROI gives you a clear way to justify platform investment to leadership. Without concrete numbers, ecommerce initiatives often get deprioritized against projects with more obvious returns.
ROI measurement also reveals which workflows actually drive value. You might discover that ERP integration saves more money than you expected, or that your quick order page generates higher average orders than your standard catalog.
- Justifies platform investment: Helps you build the business case for ecommerce spend with real numbers
- Identifies high-value improvements: Shows which workflows—pricing, ordering, fulfillment—drive the most return
- Proves value to stakeholders: Gives leadership clear metrics beyond “we have a website”
How to calculate ROI in B2B ecommerce
The B2B ecommerce ROI formula
The standard formula is straightforward:
ROI = (Net Gain from Investment – Cost of Investment) / Cost of Investment × 100
In a B2B context, “net gain” includes both new revenue and cost savings from operational efficiency. If your ecommerce platform generates $50,000 in new wholesale orders and saves $20,000 in labor costs, your total gain is $70,000.

Revenue inputs to include
When calculating the revenue side, focus on gains directly attributable to your B2B ecommerce operation:
- New wholesale orders placed online: Orders that previously required phone, email, or fax
- Increased average order value (AOV): Larger orders driven by volume pricing, upsells, or reorders
- Repeat purchase revenue: Revenue from self-serve reordering by existing B2B customers
Cost inputs to include
The cost side often gets underestimated. Include everything that goes into running your B2B channel:
- Platform and app fees: Monthly or annual subscription costs for your B2B ecommerce solution
- Implementation and customization: One-time setup, ERP/CRM integration, and onboarding costs
- Ongoing operational costs: Staff time for order management, customer service, and manual data entry
What counts as a good ROI in B2B ecommerce
A healthy ROI benchmark depends on your business model and timeline. Many B2B merchants aim for at least a 2:1 return, meaning they generate at least twice what they spend on their ecommerce operation.
ROI typically improves over time as operational efficiencies compound. Your first year might show modest returns while you’re still migrating buyers online and refining workflows. By year two or three, the same platform investment often delivers significantly higher returns as adoption scales.
Key metrics to measure B2B ecommerce ROI
Average order value
Average order value (AOV) measures the typical dollar amount per wholesale order. In B2B, AOV tends to be significantly higher than B2C, and pricing rules like volume discounts and tiered pricing directly impact this number.
Tracking AOV over time shows whether your pricing strategy is encouraging larger orders or leaving money on the table.
Wholesale conversion rate
Conversion rate in a B2B context is the percentage of logged-in wholesale buyers who complete an order. B2B benchmarks differ from B2C—you’re working with a smaller, pre-qualified audience, so conversion rates are typically higher.
A low conversion rate often signals friction in your ordering process: clunky checkout, missing payment terms, or a catalog that’s hard to navigate.
Repeat purchase rate
B2B relationships are ongoing, and repeat purchases from existing accounts often drive most of your revenue. Self-serve reordering—where buyers can quickly reorder past purchases without contacting your team—is one of the strongest ROI levers available.
Cost per order processed
This metric captures the operational cost required to process each wholesale order, including staff time, manual entry, and error correction. Lower cost per order means higher ROI, and it’s often where B2B ecommerce delivers the most dramatic improvements.
Customer service ticket volume
A well-designed B2B ecommerce platform reduces “where’s my order” and pricing inquiry tickets. Fewer tickets mean lower support costs and more time for your team to focus on high-value activities.
Where ROI in B2B ecommerce comes from
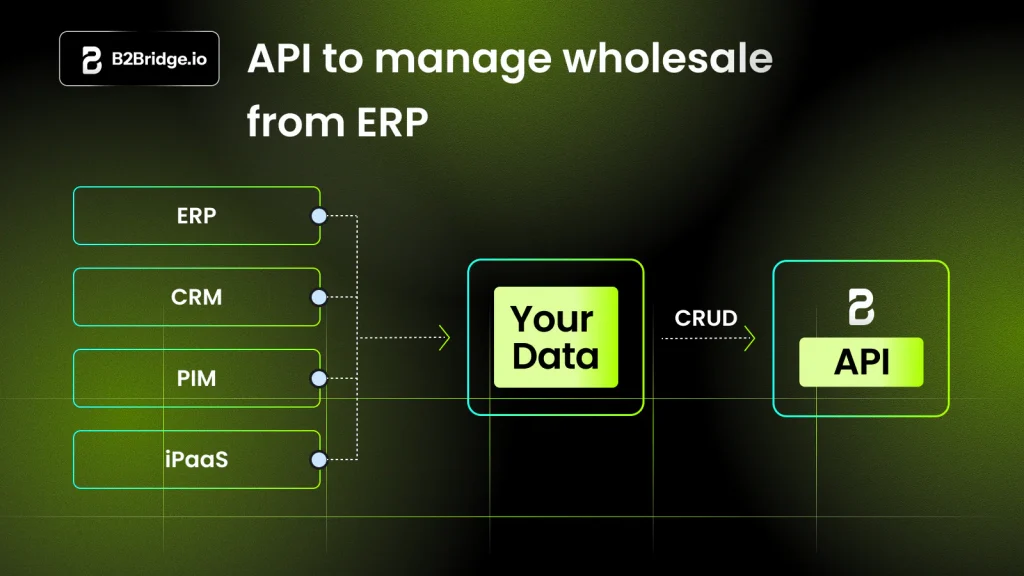
ERP and CRM integration savings
Syncing your B2B store with NetSuite, Zoho, Odoo, or custom ERPs eliminates manual data entry and reconciliation errors. When orders, customers, and pricing flow automatically between systems, your team stops spending hours fixing mismatches.
Outcome: Fewer errors and less staff time spent reconciling orders.
Advanced pricing engine uplift
Contract pricing, volume rules, customer-specific price lists, and tiered discounts encourage larger orders without additional sales effort. When buyers see their negotiated pricing automatically applied, they’re more likely to complete purchases online.
Outcome: Higher AOV without additional sales effort.

Self-serve B2B buyer experience
Quick order pages, saved carts, and reorder flows let buyers place orders without contacting your team. This is especially valuable for repeat purchases—buyers can reorder in minutes rather than waiting for a sales rep to process their request.
Outcome: More orders processed with less staff involvement.

Quote-to-order and RFQ automation
RFQ (request for quote) workflows are common in B2B, especially for large or custom orders. Automating the quote process—letting buyers request quotes online and convert approved quotes to orders in one click—reduces back-and-forth and speeds up large-deal conversion.
Outcome: Faster time-to-close on high-value orders.

Unified B2B and B2C on one storefront
Running B2B and B2C on a single Shopify store instead of separate platforms cuts operational overhead. You maintain one catalog, one inventory, and one team rather than duplicating effort across multiple sites.
Outcome: Lower platform and staffing costs.
Common barriers to realizing B2B ecommerce ROI
Disconnected ERP and CRM systems
When your ecommerce platform doesn’t sync with your ERP or CRM, you spend hours reconciling orders, customers, and pricing manually. This hidden cost erodes ROI even when revenue looks healthy.
Rigid pricing rules
Generic ecommerce platforms often don’t support contract pricing, customer-specific lists, or volume rules. Workarounds—like manually adjusting prices or maintaining separate spreadsheets—create errors and erode margins.
Separate B2B and B2C stores
Running two storefronts doubles your catalog management, inventory sync, and operational workload. The overhead often outweighs any perceived benefits of keeping channels separate.
Low wholesale conversion
A poor B2B UX—no quick order, no net terms, clunky registration—causes buyers to abandon carts or call/email instead. Every order that goes through a manual channel instead of self-serve reduces your ROI.
How to build the business case for B2B ecommerce
Step 1: Define your B2B objectives
Start by identifying what you want to achieve: grow wholesale revenue, reduce order processing costs, expand to new regions, or improve buyer retention. Clear objectives make it easier to measure success later.
Step 2: Estimate revenue and efficiency gains
Project the value of new orders, increased AOV, and operational savings like reduced manual entry and fewer support tickets. Use historical data where possible—how many orders currently come through phone or email that could move online?
Step 3: Account for platform and implementation costs
List all costs: platform fees, integration work, onboarding, and ongoing support. Don’t forget staff time for training and the initial migration period.
Step 4: Model your ROI projection
Apply the ROI formula using your estimates. Show the expected payback period—how long until the investment pays for itself.
Step 5: Address risks and dependencies
Identify what could delay or reduce ROI: integration complexity, team adoption, or data migration challenges. Planning mitigation steps upfront strengthens your business case.
How to improve ROI in B2B ecommerce
1. Sync pricing and customers with your ERP
Connect your B2B store to your ERP so price lists, customer groups, and orders stay aligned automatically.
Outcome: No manual reconciliation and fewer pricing errors.
2. Use contract and volume pricing to lift AOV
Set up tiered discounts, customer-specific pricing, and minimum order quantities to encourage larger orders.
Outcome: Higher revenue per order.
3. Add quick order and reorder flows
Enable bulk ordering via quick order pages, CSV upload, and one-click reorder.
Outcome: Faster checkout and more repeat purchases.
4. Offer net terms and credit limits
Let approved buyers pay on Net 30/60 terms with credit limits. This removes purchase friction for established accounts.
Outcome: Increased order frequency.
5. Automate RFQ and quote-to-order
Let buyers request quotes online and convert approved quotes to orders in one click.
Outcome: Faster sales cycles and less back-and-forth.
How long it takes to see ROI on a B2B ecommerce platform
ROI timeline depends on implementation complexity, team adoption, and buyer migration. Most merchants see initial returns within a few months of launch as early adopters start ordering online.
The real gains compound over time. As more buyers adopt self-serve ordering and your team refines workflows, the same platform investment delivers increasingly higher returns.
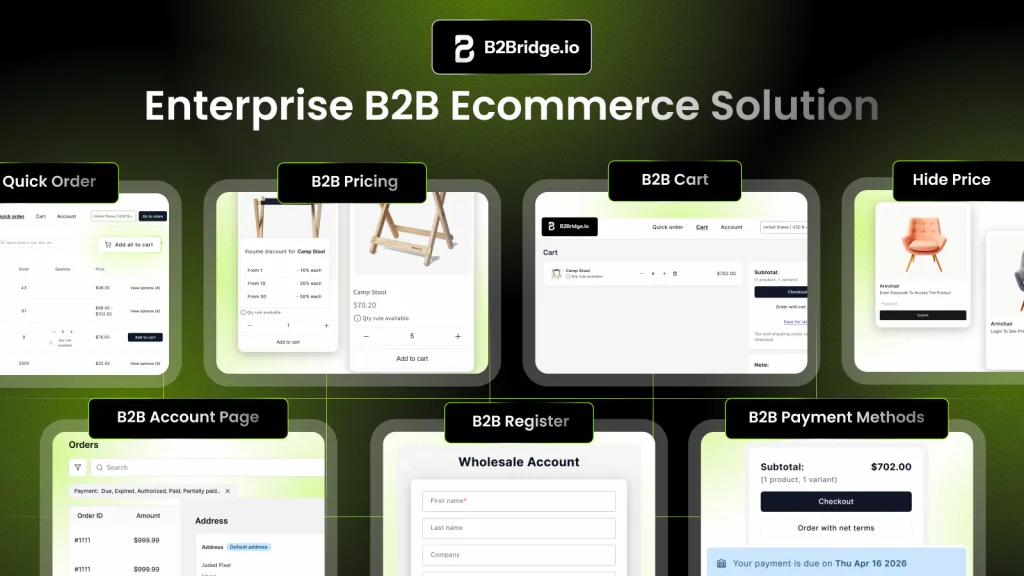
Run a higher ROI B2B operation with B2Bridge
B2Bridge embeds enterprise-grade B2B operations directly into Shopify—advanced pricing, ERP/CRM integration, and a B2B UX designed for conversion—so you can drive ROI without running a second platform. Whether you’re managing contract pricing, net terms, or quote-to-order workflows, everything runs inside your existing Shopify store.
Book A Demo to see how B2Bridge supports higher-ROI B2B ecommerce on Shopify.
FAQs about ROI in B2B ecommerce
What is the 80/20 rule in B2B ecommerce?
The 80/20 rule suggests that roughly 80% of your wholesale revenue comes from 20% of your B2B customers. Focusing on high-value accounts and their buying experience often yields the highest ROI.
What does a 22% ROI mean for a B2B ecommerce store?
A 22% ROI means that for every dollar you invest in your B2B ecommerce platform, you generate 22 cents in net profit after covering all costs—a positive return, though most merchants aim higher as operations mature.
Does achieving strong B2B ecommerce ROI require Shopify Plus?
No. You can achieve strong B2B ecommerce ROI on standard Shopify plans by using an enterprise-grade B2B app like B2Bridge that adds advanced pricing, ERP integration, and wholesale workflows without requiring a Plus upgrade.
How do you measure ROI before launching a B2B ecommerce store?
You estimate projected revenue gains—new orders, higher AOV—plus operational savings like reduced manual entry and fewer support tickets, then compare them to platform and implementation costs to model expected ROI.
What is the typical payback period for a B2B ecommerce platform?
Payback period varies by business complexity and buyer adoption, but many B2B merchants recover their platform investment within the first year as self-serve ordering scales and operational efficiencies compound.