B2B ecommerce hit $36.86 trillion globally in 2026—roughly six times larger than B2C. Yet most conversations about online selling still focus on consumer transactions, leaving wholesale businesses without the benchmarks they need to make informed decisions.
This guide compiles 57 statistics covering market size, growth rates, buyer behavior, technology adoption, and regional breakdowns so you can see exactly where B2B digital commerce stands and where it’s heading.
What Is B2B Ecommerce
The global B2B ecommerce market reached $36.16 trillion in 2026, according to Mordor Intelligence research. That figure dwarfs B2C ecommerce by roughly 5-6x, yet many wholesale businesses still underestimate how quickly digital channels are reshaping business-to-business transactions.
B2B ecommerce refers to online transactions between businesses. Manufacturers sell to distributors. Wholesalers supply retailers. Brands fulfill orders for resellers. Each relationship follows a distinct B2B ecommerce model with its own pricing and fulfillment logic. Unlike B2C, where individual consumers make purchases, B2B involves larger order volumes, negotiated pricing, and payment terms like Net 30 or Net 60.
- GMV (gross merchandise value): The total value of goods sold through a platform before deductions like returns or fees
- Net payment terms: Payment arrangements where buyers pay invoices within a set period (Net 30 means payment due in 30 days)
- CAGR (compound annual growth rate): The mean annual growth rate over a period longer than one year
Global B2B Ecommerce Market Size Statistics
The scale of B2B ecommerce often surprises people encountering it for the first time. According to Mordor Intelligence, the global B2B ecommerce market is valued at $36.86 trillion in 2026 and projected to reach $61.66 trillion by 2031.
| Metric | 2026 Value | Source |
|---|---|---|
| Global B2B ecommerce market size | $36.86 trillion | Mordor Intelligence |
| APAC share of global B2B GMV | 79% | Statista |
| China B2B ecommerce market | $18.4 trillion | Statista |
| US B2B marketplace sales | $224 billion | Statista |
Several forces drive this scale. Digital procurement has become standard at enterprise companies. Cross-border B2B trade continues expanding as platforms reduce friction. And B2B marketplaces like Alibaba and Amazon Business have made it easier for buyers to discover and transact with new suppliers.
B2B Ecommerce Growth Rate and Forecast Statistics
How fast is B2B ecommerce actually growing? The numbers point to sustained double-digit expansion through the end of the decade.
According to Mordor Intelligence, the global B2B ecommerce market is growing at a CAGR of 10.84% and will reach $61.66 trillion by 2031. Sellers Commerce reports a higher estimate of 14.5% CAGR, projecting $41.40 trillion by 2027.
Digital Commerce 360 reports that US B2B ecommerce site sales surged to $2.3 trillion in 2024, growing more than 10% year-over-year. That number is on track to surpass $3 trillion by 2028.
What’s fueling this growth? Buyer preference shifts toward self-service, marketplace adoption accelerating, and legacy businesses finally digitizing wholesale operations all contribute. The pandemic compressed years of digital transformation into months, and buyer habits stuck.
US B2B Ecommerce Statistics
The United States remains one of the largest B2B ecommerce markets globally, though ecommerce penetration still has room to grow.
| Metric | Value | Source |
|---|---|---|
| Total US B2B sales (2025) | $15+ trillion | Digital Commerce 360 |
| US B2B ecommerce sales (2024) | $2.3 trillion | Digital Commerce 360 |
| Year-over-year growth (2025) | 0.4% total sales; 10%+ ecommerce | Digital Commerce 360 |
Here’s what stands out: total B2B sales grew just 0.4% in 2025, following 1.0% growth in 2024. Yet ecommerce within that total grew over 10%. The shift isn’t about the overall market expanding. Digital channels are capturing share from traditional sales methods like phone orders and sales rep visits.
For wholesale businesses, this signals that buyers increasingly expect to transact online. If your competitors offer self-serve ordering and you don’t, you’re likely losing deals you never knew about.
B2B Ecommerce Statistics by Region
B2B ecommerce adoption varies dramatically by geography. Understanding regional dynamics helps you prioritize expansion and localization efforts.
North America B2B Ecommerce Statistics
North America shows high digital maturity, with US B2B ecommerce exceeding $2.3 trillion annually according to Digital Commerce 360. Marketplace adoption is accelerating, and buyers increasingly expect B2C-like experiences with fast search, transparent pricing, and easy reordering.
APAC B2B Ecommerce Statistics
Asia-Pacific dominates global B2B ecommerce, accounting for 79% of worldwide GMV according to Statista. China alone represents an $18.4 trillion market. Platforms like Alibaba have normalized digital wholesale transactions at a scale unmatched elsewhere.
Europe B2B Ecommerce Statistics
European B2B digital commerce is growing steadily, with Germany and the UK leading adoption. Cross-border B2B trade within the EU benefits from regulatory harmonization, though complexity remains for businesses selling across multiple VAT jurisdictions.

B2B Buyer Behavior Statistics
Understanding how B2B buyers actually purchase helps you design experiences that convert. The data reveals a clear preference for self-service over sales rep interaction.
According to Deloitte’s 2026 B2B commerce research, high-maturity suppliers beat annual sales goals by a 110% greater margin than low-maturity suppliers. Digital commerce maturity refers to how well a business has integrated technology across sales operations, from pricing automation to ERP synchronization.
- Self-service preference: B2B buyers increasingly prefer digital self-service for reorders and routine purchases
- Research behavior: A significant portion of the buyer journey now happens digitally before any sales contact
- Reorder expectations: Buyers expect one-click reordering, saved carts, and order history access
What does this mean for your wholesale operation? If buyers can’t find pricing, place orders, or check status without calling someone, you’re creating friction that competitors can exploit.
B2B Ecommerce Channel and Marketplace Statistics
Where are B2B sellers actually transacting? The channel mix is shifting toward marketplaces and omnichannel strategies.
A B2B marketplace is a digital platform where multiple business sellers offer products to business buyers. Amazon Business and Alibaba are the largest examples. According to Statista, US B2B marketplace sales reached $224 billion.
- Marketplace growth: B2B marketplaces are growing faster than direct ecommerce channels
- Omnichannel selling: Successful B2B sellers now operate across multiple channels, including direct sites, marketplaces, and sales rep-assisted transactions
- Direct ecommerce: Still the largest channel for established brands, but marketplace presence is increasingly expected by buyers
The strategic question: do you sell direct, through marketplaces, or both? For most wholesalers, the answer is increasingly “both.” Your direct channel offers better margins and customer relationships, while marketplaces provide discovery and reach.
B2B Ecommerce Technology and AI Statistics
Technology investment separates high-performing B2B sellers from the rest. Deloitte research found that high-maturity suppliers beat annual sales goals by a 110% greater margin than low-maturity suppliers.
| Technology Area | Adoption Trend |
|---|---|
| ERP integration | Standard for enterprise; growing for mid-market |
| AI/ML implementation | Early adoption phase |
| Automated pricing | Accelerating as manual processes prove unsustainable |
| Personalization tools | Expected by enterprise buyers |
For Shopify merchants, this often means connecting your storefront to your ERP (NetSuite, Zoho, Odoo) so pricing, inventory, and customer data stay synchronized. Manual data entry between systems creates errors and slows operations. Solutions like B2Bridge provide enterprise API connections to keep data aligned across platforms.
B2B Ecommerce Statistics for Manufacturers, Wholesalers, and Distributors
B2B ecommerce performance varies by business model. Here’s how the numbers break down across verticals.
Manufacturer B2B Ecommerce Statistics
Manufacturers are increasingly selling direct-to-business (D2B), bypassing traditional distribution. Ecommerce adoption among manufacturers lags other segments but is accelerating as brands seek margin improvement and customer data ownership.
Wholesaler B2B Ecommerce Statistics
Wholesalers often report higher average order values online than through traditional channels. Digital ordering reduces errors and enables volume-based pricing automation that encourages larger purchases.
Distributor B2B Ecommerce Statistics
Distributors face pressure from both directions: manufacturers going direct and marketplaces capturing share. Distributors investing in digital portals with value-added services like technical support, inventory management, and custom kitting are defending their position.
B2B Ecommerce ROI and Performance Benchmark Statistics
What return can you expect from B2B ecommerce investments? Deloitte’s research provides useful context: high-maturity suppliers beat annual sales goals by 110% more than low-maturity competitors.
| Benchmark | Typical Range |
|---|---|
| B2B conversion rate | 2-5% |
| B2B average order value | Higher than B2C |
| Cart abandonment | Common challenge |
The investment in technology pays off in measurable revenue performance. Tracking your conversion rate, AOV, and reorder rate monthly helps identify gaps and prioritize improvements.
B2B vs B2C Ecommerce Statistics
The scale difference between B2B and B2C ecommerce often surprises people.
| Metric | B2B Ecommerce | B2C Ecommerce |
|---|---|---|
| Global market size | $36+ trillion | ~$5-6 trillion |
| Average order value | Higher | Lower |
| Purchase cycle | Days to months | Minutes to days |
B2B is roughly 5-6x larger than B2C by transaction value. Yet B2C has historically received more attention from platform developers and technology vendors. That’s changing as Shopify’s B2B features have expanded significantly, but the gap in tooling sophistication still exists for some use cases.
B2B Ecommerce Trends Shaping the Wholesale Market
The statistics point to several trends reshaping how wholesale businesses operate.
- Self-service portals: Buyers want independence. Quick order pages, saved carts, and order history access reduce reliance on sales reps.
- Personalized pricing: Customer-specific and contract-based wholesale pricing is becoming standard. Generic price lists frustrate buyers who expect their negotiated rates.
- Unified storefronts: Running B2B and B2C from a single platform reduces operational complexity. Separate stores mean double the maintenance.
- Net terms digitization: Manual invoicing is giving way to automated Net 30/60 terms integrated into checkout.
- ERP-connected commerce: Real-time synchronization between storefront and back-office systems eliminates data silos and reduces errors.
BigCommerce reports that B2B ecommerce site sales are on track to surpass $3 trillion by 2028, with digital channels continuing to capture share from traditional sales methods.
How to Turn These B2B Ecommerce Statistics Into Action
Statistics only matter if you act on them. Here’s how to apply market insights to your wholesale operations.
1. Audit Your Wholesale Pricing and Order Rules
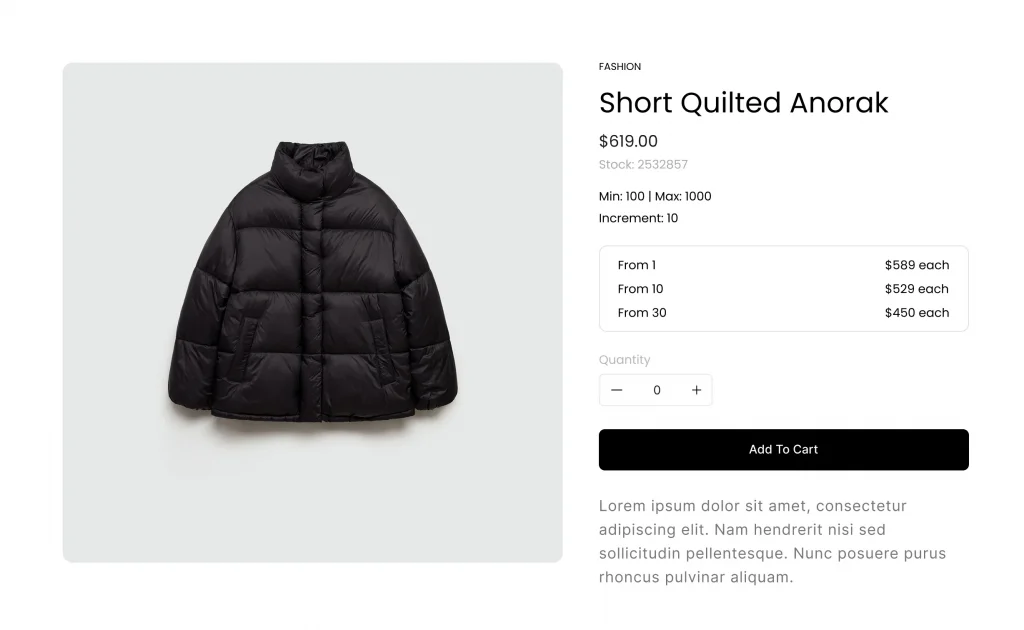
Review your current pricing structure against buyer behavior data. Do you offer volume discounts that are visible and easy to understand? Are your minimum order quantities aligned with what buyers expect? Transparent tiered pricing displayed clearly on product pages increases average order value.
2. Connect Your Storefront to Your ERP and CRM
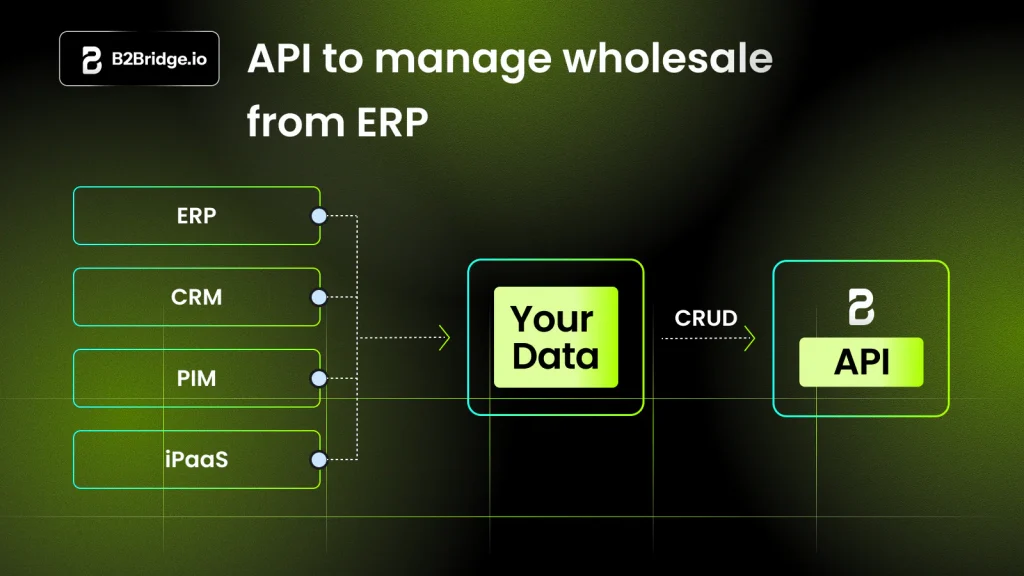
Based on technology adoption patterns, evaluate your system integration. If pricing, customers, and orders aren’t synchronized across platforms, you’re creating manual work and error risk. B2Bridge connects Shopify stores to NetSuite, Zoho, and Odoo to keep data aligned.
3. Launch a Self-Serve B2B Buying Experience
Buyer behavior data shows clear preference for self-service. Implement quick order pages for bulk purchasing, saved carts for repeat buyers, and easy reordering from order history. B2Bridge provides dedicated B2B cart functionality with net payment terms built in.
4. Unify B2B and B2C Operations on One Store
Market trends support consolidated operations. Running both channels from a single Shopify store, with B2B pricing and features visible only to logged-in wholesale customers, cuts operational complexity in half.
5. Measure Conversion, AOV, and Reorder Benchmarks
Track performance monthly, identify gaps, and prioritize improvements based on where you fall short of industry benchmarks.

Frequently Asked Questions About B2B Ecommerce Statistics
What is the 80/20 rule in ecommerce?
The 80/20 rule (Pareto Principle) states that roughly 80% of your revenue comes from 20% of your customers. In B2B, this is why customer segmentation and personalized pricing for high-value accounts matter. Your top buyers often deserve different treatment than occasional purchasers.
What are the 5 Cs of ecommerce?
The 5 Cs are Company, Customers, Competitors, Collaborators, and Context. This strategic framework helps analyze your market position. When evaluating B2B ecommerce investments, the framework helps you assess where you stand relative to market benchmarks.
What is the average success rate of B2B sales?
B2B sales success rates vary widely by industry and method. Digital commerce channels typically show different conversion patterns than traditional sales, particularly when buyers can self-serve with transparent pricing and streamlined ordering.
What are the latest trends for B2B ecommerce?
Current B2B ecommerce trends include self-service buyer portals, AI-powered personalization, unified B2B and B2C storefronts, automated net payment terms, and deeper ERP integration. High-maturity sellers are already implementing these capabilities.

As a Product Marketing Executive at B2Bridge, I focus on the Enterprise B2B Ecommerce domain. I leverage my understanding of product and user psychology to deliver customer-centric content that addresses business challenges and fuels growth.