To determine the cost of goods manufactured (COGM), apply this formula: Beginning Work-in-progress Inventory + Total Manufacturing Costs – Ending Work-in-progress Inventory. Total manufacturing costs include direct materials used, direct labor costs, and manufacturing overhead. COGM reflects the total expenses of products that have been completed and are ready for sale within a given timeframe.
Whether you’re running a Shopify store, managing a manufacturing operation, or scaling a print-on-demand business, precise COGM calculations can mean the difference between profit and loss.

What Is Cost Of Goods Manufactured (COGM)?
Cost of goods manufactured (COGM) represents the total cost of products that a company completes during a specific accounting period. Understanding your cost of goods manufactured (COGM) is crucial for any product-based business, especially in today’s competitive Ecommerce landscape.

While many business owners focus solely on their cost of goods sold, COGM provides the foundation for accurate financial reporting, strategic pricing decisions, and sustainable profitability. Unlike simple inventory purchases, COGM encompasses all production-related expenses that transform raw materials into finished goods ready for sale.
COGM serves several critical functions in business operations:
- Financial Reporting: Provides accurate data for income statements and balance sheets
- Cost Control: Identifies areas where production costs can be optimized
- Pricing Strategy: Forms the foundation for profitable pricing decisions
- Inventory Valuation: Determines the value of finished goods inventory
COGM vs COGS: What’s the Difference?
Many business owners confuse Cost of Goods Manufactured (COGM) with Cost of Goods Sold (COGS), but these metrics serve different purposes in your financial analysis:
| Aspect | Cost of Goods Manufactured (COGM) | Cost of Goods Sold (COGS) |
| Definition | Total cost to produce goods during a specific period | Cost of goods that have actually been sold to customers |
| When Calculated | Before goods are sold | When goods are sold |
| Includes | Direct materials, direct labor, manufacturing overhead, and WIP inventory adjustments | Costs related only to goods sold, excludes unsold inventory |
| Financial Statement Impact | Reflects production costs in inventory valuation (Balance Sheet) | Affects gross profit and profitability (Income Statement) |
| Purpose | Measures production efficiency and control | Reflects cost efficiency of sales and revenue matching |
| Inventory Focus | Covers costs of all goods completed, whether sold or not | Only includes costs of goods removed from finished goods inventory |
| Tax Implications | Not directly used for tax deductions | Deductible expense that reduces taxable income |
Example: Consider a custom t-shirt business that produces 1,000 shirts in January but only sells 800. The COGM calculation would include all costs to produce the full 1,000 shirts, while COGS would only reflect the cost of the 800 shirts sold. This distinction becomes crucial when managing seasonal inventory or planning production schedules.
>> Read more:
B2B Ecommerce in 2026: What It Is and How to Start
How To Price Wholesale: Formulas & Tips To Set Up Wholesale Pricing
Why COGM Matters for Merchants and Manufacturers
Impact on Profitability and Pricing
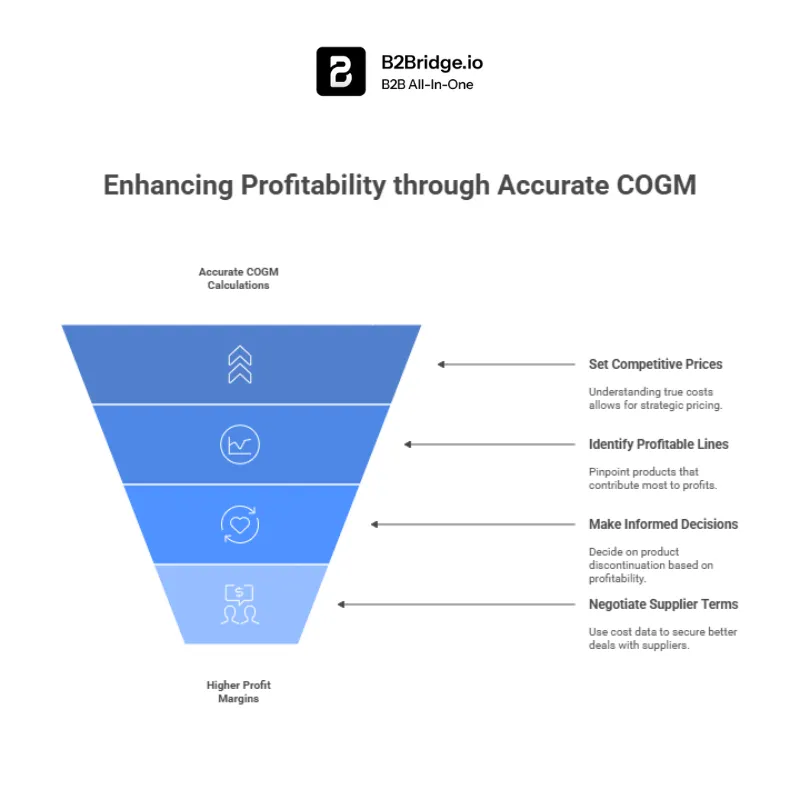
Accurate COGM calculations directly impact your bottom line. Research shows that businesses with precise cost tracking achieve 15-20% higher profit margins compared to those using estimated costs. When you understand your true production costs, you can:
Inventory and Supply Chain Implications
COGM plays a vital role in inventory management and supply chain optimization. Businesses that accurately track manufacturing costs report 25% fewer stockouts and 30% lower carrying costs. This accuracy helps you:
- Determine optimal reorder points
- Evaluate make-versus-buy decisions
- Assess supplier performance and costs
- Plan production schedules more effectively
Financial Planning and Tax Considerations
Proper COGM calculation is essential for tax compliance and financial planning. The IRS requires specific cost allocation methods for manufacturing businesses, and accurate COGM ensures compliance while maximizing legitimate deductions. Additionally, lenders and investors rely on COGM data when evaluating business performance and growth potential.
The Cost Of Goods Manufactured Formula (With Full Explanation)
The key to COGM success lies in consistent, accurate data collection and regular analysis of your results. Start with the basic formula, implement proper tracking systems, and gradually incorporate more sophisticated analysis as your business grows.
Standard COGM Formula
The basic COGM formula is:
COGM = Beginning Work-in-Process + Total Manufacturing Costs (Direct Materials Used + Direct Labor + Manufacturing Overhead) – Ending Work-in-Process
Component Breakdown
Direct Materials Used: Raw materials that become part of the finished product
- Fabric for clothing manufacturers
- Wood for furniture makers
- Electronic components for device assembly
- Packaging materials directly associated with products
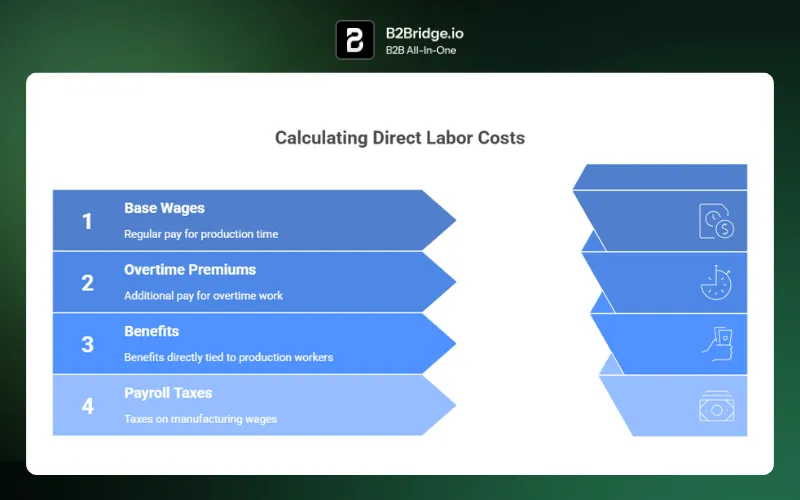
Direct Labor: Wages for employees directly involved in production
- Assembly line workers
- Quality control inspectors
- Machine operators
- Production supervisors
Manufacturing Overhead: Indirect costs necessary for production
- Factory rent and utilities
- Equipment depreciation
- Indirect labor (maintenance, cleaning)
- Factory insurance and property taxes
Inventory Methods Comparison
| Method | Description | Best For | Advantages |
| Periodic | Updates inventory at set intervals | Small businesses, seasonal operations | Simpler record-keeping, lower administrative costs |
| Perpetual | Real-time inventory tracking | High-volume operations, multiple locations | Accurate real-time data, better control |
Step-By-Step Guide: How to Calculate COGM for Your Business
Step 1: Gather essential data
Before calculating COGM, collect the following information:
- Beginning and ending work-in-process inventory values
- Raw material purchases and usage records
- Direct labor costs including benefits
- All manufacturing overhead expenses
- Production records showing completed units
Step 2: Calculate the cost of direct materials used
To determine the cost of direct materials used, start with the beginning raw materials inventory, which is the value of materials on hand at the start of the period.
Then, add the cost of raw materials purchased during the period to this amount, reflecting the total materials available for use.
Finally, subtract the ending raw materials inventory, which represents the materials remaining at the end of the period. This calculation isolates the cost of raw materials that were actually consumed in production, providing a crucial figure for determining total manufacturing costs.
Formula: Beginning Raw Materials + Purchases – Ending Raw Materials = Direct Materials Used
Example: A jewelry manufacturer starts January with $10,000 in silver and gemstones, purchases $25,000 in materials, and ends with $8,000 remaining.
Direct Materials Used = $10,000 + $25,000 – $8,000 = $27,000
Step 3: Calculate direct labor costs
Include all wages and benefits for production employees in the manufacturing process:
Step 4: Allocate manufacturing overhead
Common allocation methods include:
- Direct labor hours: Overhead cost per labor hour × actual hours
- Machine hours: Overhead cost per machine hour × actual hours
- Direct labor cost: Overhead rate as percentage of direct labor
Step 5: Complete COGM calculation example
Scenario: CustomPrint Co. (Shopify print-on-demand business)
- Beginning work-in-process: $2,000
- Direct materials used: $15,000
- Direct labor: $8,000
- Manufacturing overhead: $12,000
- Ending work-in-process: $1,500
Calculation:
COGM = $2,000 + $15,000 + $8,000 + $12,000 – $1,500 = $35,500
Common Problems When Calculating COGM
Inaccurate Inventory Tracking
Many businesses struggle with precise inventory counts, leading to COGM miscalculations. Common issues include:
- Manual counting errors
- Failure to account for work-in-process
- Inconsistent valuation methods
- Missing inventory adjustments for damaged goods
This problem typically inflates or deflates COGM by 5-15%, significantly impacting pricing decisions and profitability analysis.
Cost Misclassification (Direct vs. Indirect)
Incorrectly categorizing costs is one of the most frequent COGM errors. Examples include:
- Classifying administrative salaries as direct labor
- Including sales commissions in manufacturing overhead
- Mixing period costs with product costs
- Failing to allocate shared resources properly
Overhead Allocation Challenges
Manufacturing overhead allocation often creates calculation difficulties:
- Choosing inappropriate allocation bases
- Failing to update allocation rates regularly
- Ignoring seasonal variations in overhead costs
- Over-simplifying complex allocation scenarios
Lack of Real-Time Data
Without current information, COGM calculations become estimates rather than accurate measurements:
- Delayed cost reporting from suppliers
- Outdated labor rate information
- Inconsistent reporting periods across departments
- Manual data collection creating bottlenecks
Solutions to COGM Calculation Challenges
Leverage Automation and Software
Modern business management systems can dramatically improve COGM accuracy:
Key features to look for:
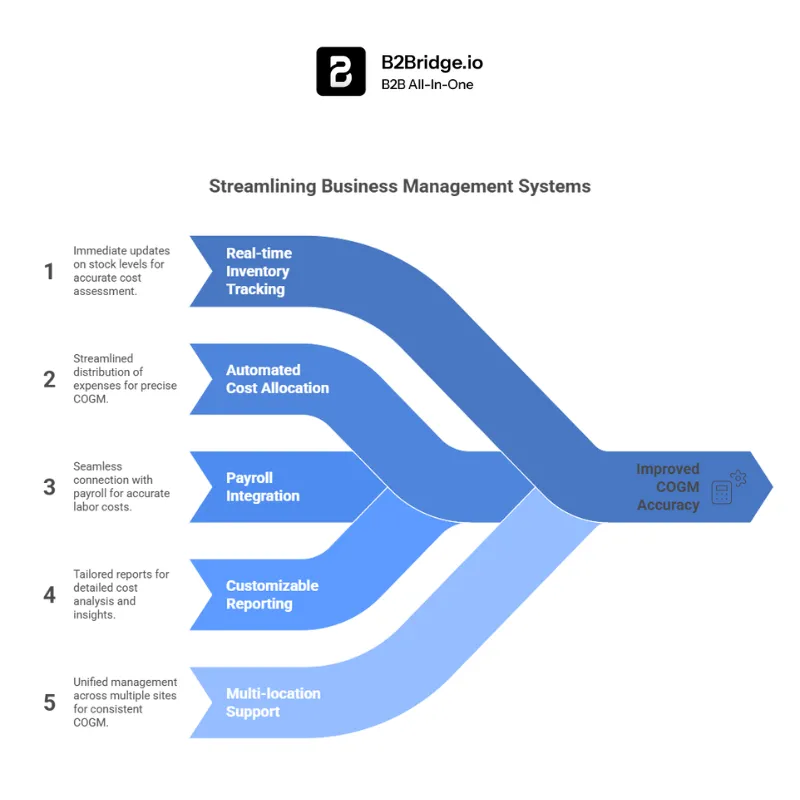
Popular solutions include QuickBooks Manufacturing, NetSuite, and specialized Ecommerce platforms that integrate with Shopify and other marketplaces.
Inventory Management Best Practices
Implement Cycle Counting: Regular partial inventory counts to maintain accuracy
Use Barcode Systems: Reduce human error in tracking materials and finished goods
Standardize Procedures: Ensure consistent counting and valuation methods
Regular Reconciliation: Compare physical counts with system records monthly
Ecommerce-Specific Strategies
Print-on-Demand Businesses:
• Track base costs separately from customization costs
• Account for design and setup time in direct labor
• Include platform fees in overhead allocation
Dropshipping Operations:
• Monitor supplier cost changes in real-time
• Factor in quality control and return processing costs
• Allocate customer service costs appropriately
Case Study: Transformation Success
Before: LocalCrafts, a handmade jewelry business, estimated COGM at $30 per piece using rough calculations. This led to underpricing and thin margins.
After: Implementing proper COGM tracking revealed actual costs of $42 per piece. With accurate data, they:
• Increased prices by 28% while remaining competitive
• Improved gross margins from 15% to 35%
• Identified the most profitable product lines
• Reduced inventory carrying costs by 20%
COGM Formula Examples & Templates
Simple Business Example: Artisan Soap Company
Monthly Data:
Beginning WIP: $500
Raw Materials: $3,200 (oils, fragrances, molds)
Direct Labor: $2,400 (production time at $20/hour)
Manufacturing Overhead: $1,800 (utilities, equipment depreciation)
Ending WIP: $400
COGM Calculation:
$500 + $3,200 + $2,400 + $1,800 – $400 = $7,500
Per Unit Cost (500 bars produced): $7,500 ÷ 500 = $15 per bar
Multi-SKU Complex Example: Electronics Assembly
Challenges for Multiple Products:
- Different material costs per SKU
- Varying labor requirements
- Shared overhead allocation
- Different production volumes
Solution Approach:
- Calculate direct costs per SKU separately
- Allocate overhead based on direct labor hours or machine time
- Sum all SKU costs for total COGM
- Track individual product profitability
Excel/Google Sheets Template Structure
Create Your COGM Spreadsheet:
Sheet 1: Data Input
- Beginning WIP inventory
- Raw material purchases and usage
- Direct labor hours and rates
- Overhead expenses by category
Sheet 2: Calculations
- Direct materials used formula
- Direct labor cost calculation
- Overhead allocation by product line
- Final COGM computation
Sheet 3: Analysis
- Cost per unit calculations
- Month-over-month comparisons
- Variance analysis
- Profitability metrics
Or you can use our available COGM template here!
Advanced COGM Insights for Entrepreneurs
Pricing Optimization Using COGM Data
Once you have accurate COGM figures, you can optimize pricing strategies:
Cost-Plus Pricing: COGM + Desired Margin = Selling Price
Example: $15 COGM + 40% margin = $21 selling price
Competitive Analysis: Compare your COGM to market prices to identify positioning opportunities
Value-Based Pricing: Use COGM as a floor price while pricing based on customer perceived value
Margin Analysis Across Product Lines
COGM data reveals which products drive profitability:
- Calculate gross margin percentage per product
- Identify high-margin items for promotional focus
- Consider discontinuing consistently low-margin products
- Analyze seasonal margin variations
Forecasting for Demand Planning
Historical COGM trends help predict future costs:
- Material cost inflation patterns
- Labor efficiency improvements
- Overhead scaling with volume changes
- Seasonal production cost variations
This analysis supports better inventory planning, cash flow management, and growth strategy development.
Cost Of Goods Manufactured FAQ
COGM = Beginning Work in Process Inventory + Total Manufacturing Costs – Ending Work in Process Inventory.
COGS is calculated by adjusting the cost of goods manufactured with beginning and ending finished goods inventory.
Manufacturing Cost = Direct Materials + Direct Labor + Manufacturing Overhead.
Add all raw materials, labor, and overhead costs incurred to produce the product to get its manufacturing cost.
COGM represents the cost to manufacture products during a period, while COGS is the cost of products actually sold. COGM affects inventory valuation; COGS affects profit calculations.
Include packaging materials that are part of the manufactured product (like branded boxes). Exclude shipping costs to customers, as these are selling expenses, not manufacturing costs.
Monthly calculations provide the best balance of accuracy and practicality. Weekly calculations may be necessary for high-volume or seasonal businesses.
Automation reduces errors, saves time, provides real-time insights, improves accuracy, and enables better decision-making through consistent reporting.
Traditional COGM doesn’t apply to pure dropshipping since you don’t manufacture products. However, you can track “cost of goods processed” including supplier costs, platform fees, and fulfillment expenses.
Conclusion
Mastering your cost of goods manufactured calculations is essential for building a profitable, sustainable business. Whether you’re tracking cost of goods for a small artisan operation or managing complex multi-SKU manufacturing, accurate COGM data provides the foundation for smart business decisions.
Ready to streamline your cost tracking and boost profitability? With B2Bridge – All-in-one B2B app, you can manage bulk orders, set custom pricing, and give buyers a smooth self-service experience. Start your free trial today and see how easy B2B selling can be.
Contact us today for a free consultation and discover how accurate cost management can transform your bottom line.
See our B2B success stories: Click here
Hi, I’m Ha My Phan – an ever-curious digital marketer crafting growth strategies for Shopify apps since 2018. I blend language, logic, and user insight to make things convert. Strategy is my second nature. Learning is my habit. And building things that actually work for people? That’s my favorite kind of win.