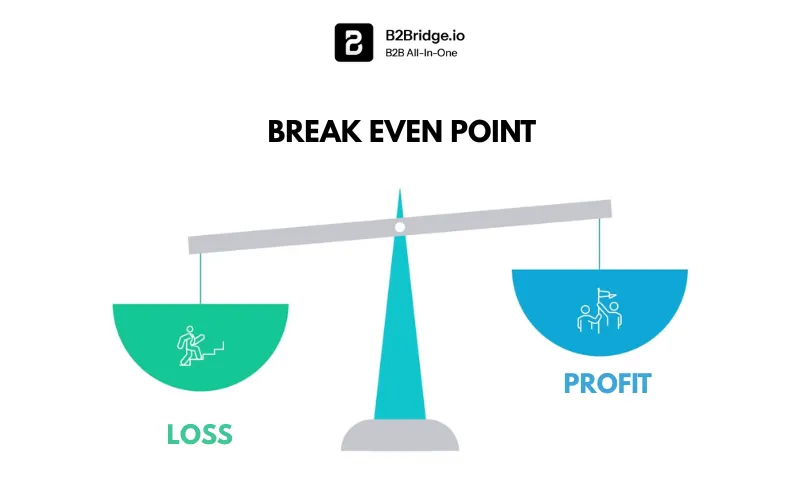
The break-even point represents that critical point where your total revenue equals your total costs – marking the transition from loss to profit. According to the U.S. Bureau of Labor Statistics, about 20% of new businesses fail during their first two years, often due to poor financial planning and misunderstanding of their break-even requirements.
In this comprehensive guide, you’ll learn everything you need to calculate your break-even point accurately, interpret the results, and use this powerful metric to accelerate your path to profitability. We’ll provide you with practical formulas, real-world examples, and a free calculator template to make the process as straightforward as possible.

What Is the Break-Even Point?
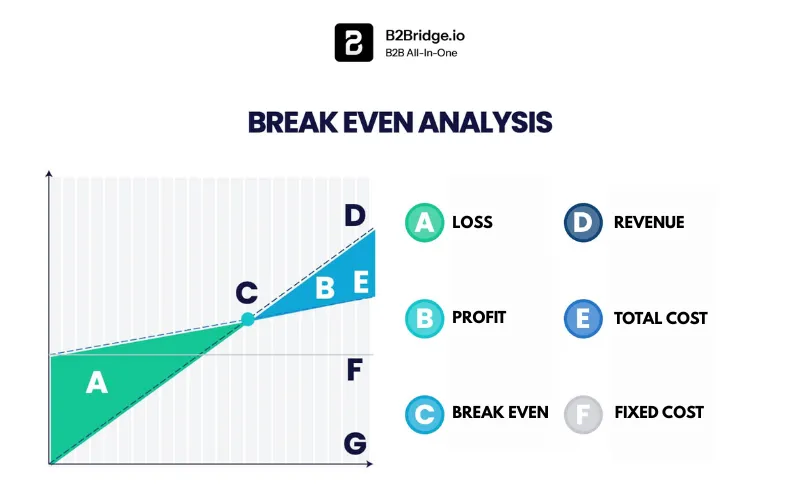
The break-even point (BEP) is the exact point where your total revenue equals your total costs – both fixed and variable – resulting in zero profit or loss. At this crucial juncture, every dollar earned covers every dollar spent, making it the foundation from which all profits are built.
Imagine you’re running a coffee shop. Your monthly rent, insurance, and salaries cost $8,000 (fixed costs), while each cup of coffee costs $1.50 to make (variable cost) and sells for $4.00. Your break-even point would tell you exactly how many cups you need to sell each month to cover all expenses before generating any profit.
The break-even point matters for three critical reasons: it determines business viability by showing whether your pricing model can sustain operations, guides strategic decisions about expansion or product launches, and provides concrete sales targets for your team to achieve profitability.
>> Read more:
B2B Ecommerce in 2026: What It Is and How to Start
How To Price Wholesale: Formulas & Tips To Set Up Wholesale Pricing
Break-Even Point Formula Explained
Unit-Based Formula (How Many to Sell?)
The unit-based break-even formula answers the fundamental question: “How many products do I need to sell to break-even?” This formula is particularly useful for businesses with clearly defined products or services with consistent pricing.
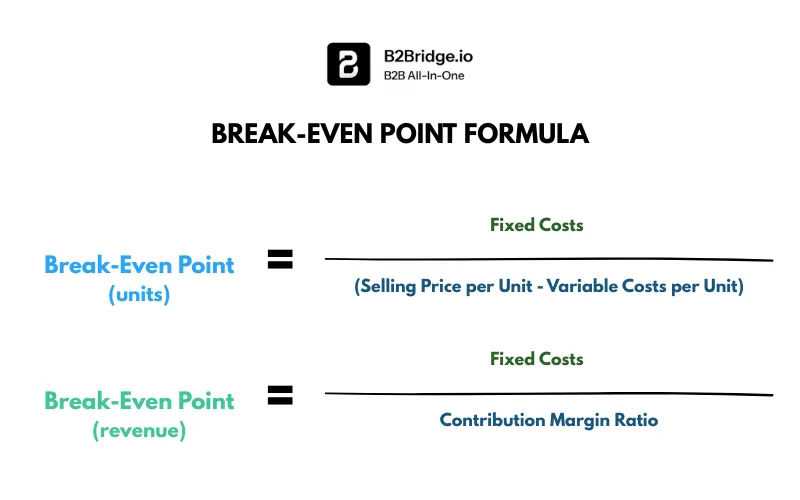
Break-even point (units) = Fixed Costs ÷ (Selling Price per Unit – Variable Costs per Unit)
Let’s apply this formula to our coffee shop example. With fixed costs of $8,000, a selling price of $4.00 per cup, and variable costs of $1.50 per cup:
Break-even point = $8,000 ÷ ($4.00 – $1.50) = $8,000 ÷ $2.50 = 3,200 cups
This means the coffee shop must sell 3,200 cups monthly to break-even. Every cup sold beyond this point generates $2.50 in profit.
Revenue-Based Formula (Target Dollar Amount)
The revenue-based formula determines the total dollar amount of sales needed to break-even, which is especially valuable for businesses with multiple products or variable pricing structures.
Break-even point (revenue) = Fixed Costs ÷ Contribution Margin Ratio
The contribution margin ratio is calculated as: (Selling Price – Variable Costs) ÷ Selling Price
Using our coffee shop example:
Contribution Margin Ratio = ($4.00 – $1.50) ÷ $4.00 = 0.625 or 62.5%
Break-even point (revenue) = $8,000 ÷ 0.625 = $12,800
This confirms our unit calculation: 3,200 cups × $4.00 = $12,800 in monthly revenue needed to break-even.
Variables Needed for Calculation
Accurate break-even calculations depend on precise identification and measurement of four key variables:
- Fixed Costs: Expenses that remain constant regardless of production volume, including rent, insurance, salaries, loan payments, and equipment depreciation. These costs occur whether you sell one unit or one thousand.
- Variable Costs: Expenses that change directly with production volume, such as raw materials, packaging, shipping, and sales commissions. Calculate this as cost per unit to maintain consistency.
- Sales Price per Unit: The amount customers pay for each product or service. For businesses with multiple price points, use weighted averages or analyze each product line separately.
- Contribution Margin: The amount remaining after variable costs are subtracted from the sales price. This represents how much each unit contributes toward covering fixed costs and generating profit.
To source accurate values, review your accounting records for the past 6-12 months, categorize expenses correctly, and update assumptions regularly as market conditions change. Remember that precision in these inputs directly impacts the reliability of your break-even analysis.
How To Calculate Break-Even Point: Step-by-Step Guide
Step 1. List Fixed Costs
Compile all expenses that remain constant regardless of sales volume. Review your monthly financial statements and identify costs like rent, insurance premiums, base salaries, loan payments, and equipment depreciation. Don’t forget less obvious fixed costs such as software subscriptions, professional memberships, and basic utilities. Total these expenses to get your monthly fixed cost figure.
Step 2. Determine Variable Cost per Unit
Calculate the cost to produce one unit of your product or deliver one instance of your service. Include direct materials, packaging, shipping, payment processing fees, and any commissions or bonuses tied to sales volume. If costs vary significantly, calculate separate variable costs for different products or use weighted averages for product lines.
Step 3. Set Your Sales Price per Unit
Establish the average price customers pay for your product or service. For businesses with multiple pricing tiers, calculate a weighted average based on sales volume at each price point. Ensure your price reflects current market conditions and includes any discounts or promotions that significantly impact revenue.
Step 4. Calculate Contribution Margin
Subtract your variable cost per unit from your sales price per unit. This contribution margin represents how much each sale contributes toward covering fixed costs and generating profit. A higher contribution margin means fewer units needed to break-even, while a lower margin requires higher sales volumes.
Step 5. Apply the Formula
Divide your total fixed costs by the contribution margin per unit to determine break-even units, or divide by the contribution margin ratio to find break-even revenue. Double-check your calculation by multiplying break-even units by price per unit—this should equal your revenue-based result.
Quick Reference Summary:
- Gather 12 months of financial data
- Separate fixed from variable costs clearly
- Use current, realistic pricing
- Verify calculations using both formulas
- Update analysis quarterly or when costs change significantly
Free Break-Even Point Calculator & Template
Simplify your break-even calculations with our comprehensive, free spreadsheet template designed for businesses of all sizes. This user-friendly tool eliminates manual calculations while providing advanced scenario modeling capabilities.
Our template features:
- Automated calculations: Simply input your costs and pricing – the template handles all formulas
- Multiple product analysis: Analyze up to 10 different products or services simultaneously
- Scenario modeling: Test different pricing strategies and cost structures instantly
- Visual charts: Clear graphs show your break-even point and profit projections
- Sensitivity analysis: See how changes in costs or prices impact your break-even point
- Mobile-friendly format: Access and update your analysis from any device
For businesses looking to integrate break-even analysis into comprehensive mobile commerce strategies, consider platforms like Simicart that offer built-in analytics tools. These solutions can automatically track the metrics needed for ongoing break-even analysis while supporting your broader business growth objectives.
Interpreting Your Break-Even Analysis
Once you’ve calculated your break-even point, the real value comes from interpreting these results to make strategic business decisions. Your break-even analysis reveals critical insights about your business model, pricing strategy, and operational efficiency.
How can you use BEP to set profit goals?
Add your desired profit margin to your fixed costs before calculating break-even. If you want $5,000 monthly profit, treat this as an additional fixed cost, requiring higher sales volumes to achieve your target.
What does your BEP tell you about cost management and pricing?
A high break-even point relative to market demand suggests either excessive fixed costs or insufficient contribution margins. Consider whether you can reduce overhead expenses, increase prices, or improve operational efficiency to lower variable costs.
What practical actions should you consider?
If your break-even point seems unattainable, explore strategic adjustments: negotiate lower rent or supplier costs, optimize your product mix toward higher-margin items, implement automation to reduce variable costs, or test premium pricing with enhanced value propositions.
Break-Even Analysis Example
The goal of a break-even analysis is to determine how many units must be sold for the company to cover all costs and reach zero net profit. In this scenario, the company must sell 8,000 units of its products to break even and begin generating profit.
From the sensitivity table, we see that the company operates at a loss until sales exceed 8,000 units. For example, if the company sells 8,500 units, it earns a net profit of $5,000.
Alternatively, the break-even point can be calculated by dividing fixed costs by the contribution margin.
The company’s total fixed costs are $80,000, and the contribution margin is the difference between the selling price per unit and the variable cost per unit. After deducting $15.00 from $25.00, the contribution margin is $10.00.
Contribution Margin = $25.00 – $15.00 = $10.00
Therefore, just like using Excel’s goal seek approach, the implied units needed to be sold to break even is 8,000 units.
Break-Even Point = 8,000 Units Sold
Why Perform a Break-Even Analysis?
Break-even analysis serves as the backbone of strategic business planning, offering insights that extend far beyond simple profit calculations. This fundamental financial tool supports multiple aspects of business operations and decision-making.
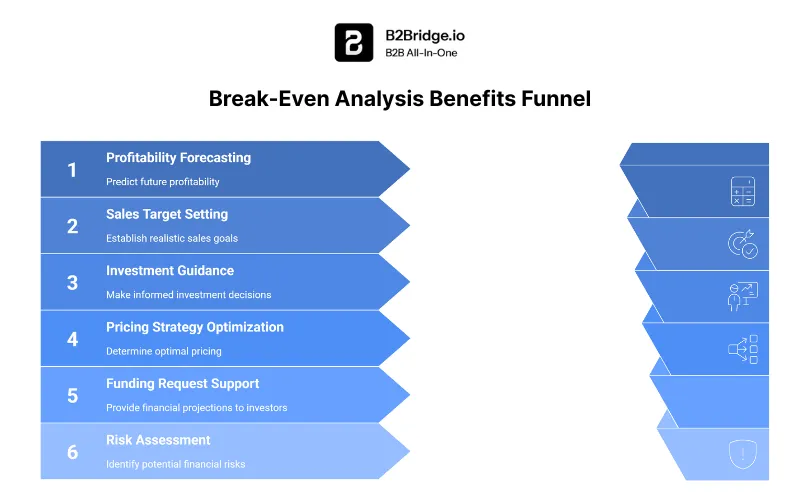
The primary benefits of conducting regular break-even analysis include:
- Profitability forecasting: Predict when your business will become profitable and by how much
- Sales target setting: Establish realistic, data-driven sales goals for your team
- Investment guidance: Make informed decisions about equipment purchases, hiring, or expansion
- Pricing strategy optimization: Determine optimal pricing that balances competitiveness with profitability
- Funding request support: Provide investors and lenders with concrete financial projections
- Risk assessment: Identify potential financial vulnerabilities before they become critical
- Resource allocation: Optimize spending across different business areas based on their impact on break-even
By understanding these strategic advantages, you can leverage break-even analysis not just as a calculation exercise, but as a comprehensive planning tool. This foundation leads us naturally into the mathematical formulas that make these insights possible.
Advanced Insights and Common Mistakes
Sensitivity Analysis
Understanding how changes in key variables impact your break-even point helps you make more informed decisions and prepare for market fluctuations. Small changes in pricing or costs can dramatically affect your profitability timeline.
- Price sensitivity: A 10% price increase might reduce your break-even point by 20-30%, but ensure market demand supports higher pricing
- Cost fluctuations: Rising material costs directly impact variable expenses, requiring immediate break-even recalculation
- Volume discounts: Higher sales volumes often reduce per-unit costs, creating a favorable feedback loop that accelerates profitability
Common Pitfalls
Underestimating costs: Many businesses forget to include all fixed costs like depreciation, professional services, or irregular expenses
Ignoring market realities: Calculating break-even without considering market size, competition, or seasonal demand can lead to unrealistic expectations
Static assumptions: Failing to update break-even calculations as business conditions change can result in outdated strategic decisions
Over-optimistic pricing: Setting prices based on desired break-even rather than market acceptance often leads to poor sales performance
Case Study
TechStart Solutions, a software development startup, initially calculated a break-even point of 150 monthly subscriptions at $99 each. However, they discovered their customer acquisition cost of $180 wasn’t included in their analysis. After recalculating with complete cost data, their break-even increased to 280 subscriptions. They responded by improving their product to justify premium pricing of $149, ultimately reducing their break-even to 210 subscriptions while maintaining market competitiveness.
Break-Even Point FAQs
The break-even point is the stage where a company’s total revenue matches its total costs. At this point, the business neither makes a profit nor incurs a loss. It represents the production or sales level where expenses are fully covered by income.
To find the number of units needed to break-even, use the formula:
Break-even (units) = Fixed Costs ÷ (Selling Price per Unit – Cost per Unit)
This tells you how many units must be sold before the business begins generating net profit.
Simply put, the break-even point (BEP) is when the money a business earns is exactly equal to the money it spends – no profit, no loss.
Recalculate your break-even point monthly or quarterly, and track trends rather than focusing on single calculations. Consider using rolling averages for variable costs and updating fixed costs whenever significant changes occur.
Create a weighted average contribution margin based on your sales mix, or calculate break-even for each product line separately. Focus additional resources on products with higher contribution margins to optimize overall profitability.
No, break-even analysis focuses on ongoing operational profitability, while payback period measures how long it takes to recover initial investments. Both metrics are important but serve different strategic purposes.
Absolutely. Define “units” as service hours, projects, or client engagements. Variable costs might include subcontractor fees, materials, or travel expenses, while fixed costs include office rent and staff salaries.
Actionable Tips To Reach Break-Even Faster
Accelerating your path to profitability requires strategic focus on the key drivers of break-even performance:
- Raise prices strategically: Test small price increases with existing customers, emphasize value propositions, or introduce premium service tiers
- Reduce variable costs: Negotiate better supplier terms, optimize production processes, or find alternative materials that maintain quality
- Lower fixed costs through automation: Implement technology solutions that reduce labor costs or eliminate manual processes
- Improve sales efficiency: Focus marketing efforts on highest-converting channels and optimize your sales funnel for better conversion rates
- Enhance customer lifetime value: Develop retention strategies that increase repeat purchases and reduce customer acquisition costs
- Use mobile sales tools: Leverage platforms like Simicart to create mobile apps that improve customer engagement and increase sales velocity
Conclusion
Mastering your break-even point calculation is more than just a financial exercise – it’s the foundation of sustainable business growth. By understanding exactly when your business transitions from loss to profit, you can make informed decisions about pricing, investments, and operational strategies that accelerate your path to success.
With the formulas, examples, and tools provided in this guide, you have everything needed to take control of your financial destiny.
Discover how to master your business finances with our break-even point formula guide and free customizable template. Ready to take control of your sales targets? Use B2Bridge – All-in-one app to streamline your calculations, and explore our flexible pricing plans.
→ Contact us today to get started
→ See how customers like you have succeeded
Hi, I’m Ha My Phan – an ever-curious digital marketer crafting growth strategies for Shopify apps since 2018. I blend language, logic, and user insight to make things convert. Strategy is my second nature. Learning is my habit. And building things that actually work for people? That’s my favorite kind of win.